Still pretty silly micro-managing. I expect better out of Maddon.
2012 Tampa Bay Rays Thead
Collapse
X
-
-
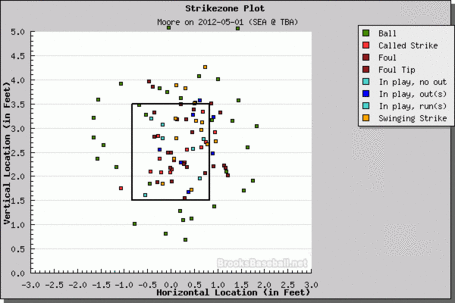
DRaysbay profiled how Moore is a notoriously slow starter and has issues with control in his first 4-5 starts. It was actually a pretty revealing piece b/c it has been consistent throughout his career in the minors and it has been that way thus far as well. He really isn't getting deep into games and is having a relatively high level of walks.Maddon & Friedman: Pissing off the AL East since 2008
Comment
-
Dana Eveland did everything to give away that game yesterday and the Rays would just not accept the gift. 13 runners got on in 6 innings, 6 walks, 2 HBP, 5 hits. Leave it to the Rays to only get 3 runs out of that. Pena is in one of his usual slumps where he just needs to be moved down till he gets back in a rhythm, right now he is just striking out and looking terrible at the plate. Team looks like complete dog shit at the plate without Longo and Jennings, and all these AAA players.Comment
-
Might as well bump this thread as we head into the last quarter of the season.

http://www.draysbay.com/2012/8/24/3263779/david-price-brings-super-quality-to-each-start#storyjump
The term quality start was developed by Philadelphia Inquirer writer John Lowe (now with the Detroit Free Press) back in 1985 and was defined as a starting pitcher going at least 6 innings and giving up no more than 3 earned runs. The statistic in itself is often mocked due to the fact that the minimums for being credited for a quality start equates to a 4.50 ERA so where is the quality in that?
To be fair, most quality starts aren't the minimum 6 inning 3 run variety and it is also true that a teams winning percentage is very good when the starter delivers a quality start. For instance, in the American League this year there have been 883 quality starts and the pitchers team has won 619 of those games for a .702 winning percentage, in 2011 it was .679 (815/1200), and in 2010 it was .681 (818/1200).
Andy K while blogging for Baseball-Reference.com (currently at High Heat Stats) took a look at the quality start and produced the following two charts showing the year to year overall percentage of quality starts in MLB and the teams winning percentage in those game in an article titled Is Quality Starts a Useful Stat? (not really).
ESPN.com has built off of the Quality Start statistic with two categories. The first is a tough loss and this is earned when a pitcher loses a start in which he delivers a quality start and a cheap win is earned when a starting pitcher earns a win in a non quality start. The ESPN.com leader board with the tough loss and cheap win statistics is provided here. The AL Leader in tough losses is Jeremy Hellickson (tied with C.J. Wilson andJake Peavy) with 5.
Nolan Ryan has been one of the more vocal critics against the traditional Quality Start statistic and believes that a better measure would be 7 innings pitched and no more than 3 earned runs allowed. Wayne G. McDonnell, a contributor at Forbes Magazine, took Ryan's model and developed a model for a Quality Start Factor based on earned runs, number of pitches thrown, and innings pitched.
David Price has thrown 12 quality starts in a row, in 80% of his starts he's earned a quality start, and he leads the AL with 20 of them. Teammates Jeremy Hellickson and James Shields have 15 quality starts (65%) and 14 (64%) respectively This led me to wonder how would David Price and others stack up if evaluated by the Nolan Ryan definition which we'll call the Super Quality Start and would we be able to discern anything from the Quality Score Factor?
Using Baseball-Reference's Play Index I queried all AL starters who had a minimum of 10 traditional quality starts and this list returned 44 names. I then ran the same search using the Super Quality Start metric and eliminated pitchers with less than 8 Super Quality Starts and this list included 24 pitchers.
The table below shows the 24 pitchers who had at least 8 quality starts. The data includes the number of starts, quality starts, percentage of quality starts, super quality starts, percentage of super quality starts, the quality start factor, and the convert percentage (# of traditional quality starts that were maintained to super quality start status). I have presented the Quality Start Factor but there doesn't seem to be much variance. For reference the score for pitchers will be somewhere between 10-20 and the lower the score the better.
The table above shows that David Price has converted 90% of his quality starts from the traditional quality start to super quality start and the only pitchers to best him are Felix Hernandez who has converted all 100% of his,Clay Buchholz who has converted 91.91%, and Bartolo Colon who had converted 91.67 of his. There are certainly some interesting names on the above list that caught me by surprise including Phil Hughes, Clay Buchholz, and Henderson Alvarez.
The table below presents some of the more traditional pitching metrics to the QS% and SQS%.
As the data shows above their are several pitchers who have a high frequency of quality start percentage and super quality start percentage. As can be expected these pitchers form an elite group led by David Price. Although the quality start may be a great minimum statistic for a starting pitcher to achieve the ability to consistently achieve super quality starts is what separates the top of the rotation pitcher from the rest.Comment


Comment